
Real Vessels. Verified Savings.
Energy performance from optimization projects across multiple vessel types, verified against agreed baselines through eMarine Cloud.
Deployed across cargo, cruise and ferry fleets

Bulk carriers

Cruise

RoRo / Vehicles

Ferries
Estimated Annual Impact Across the Fleet.
Based on year-to-date performance from 100+ vessels connected to eMarine Cloud. Typical project payback is 9–18 months.
- Annual energy savings
- 126,600 MWh
- Annual fuel savings
- 28,800 metric tons
- Annual fuel cost savings
- USD 21.6 million
Fuel cost calculated at USD 750 per metric ton.
Three Vessel Types. Measured Results.
Actual performance from three vessels in operation. Energy savings are verified against an agreed baseline using the latest 365 days of operating data. Fuel, cost and CO₂ equivalents are calculated using defined conversion factors and fuel-price assumptions. Vessel identities are anonymized.
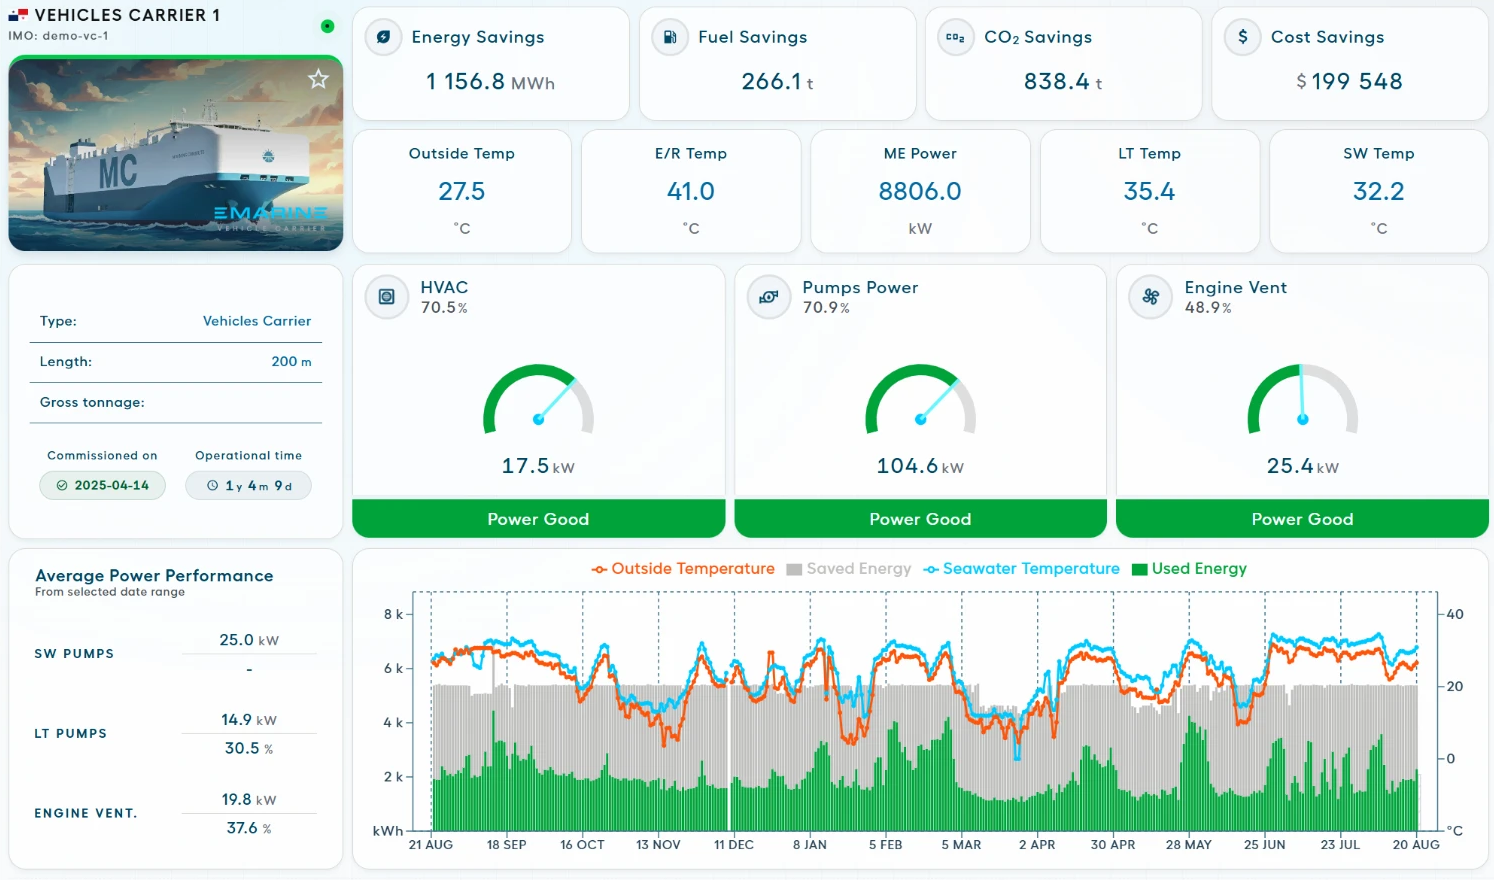
Vehicle Carrier
200 m · eMarine system commissioned: 14 April 2025
- Annual Cost Savings
- USD 199,548
- Annual Energy Savings
- 1,156.8 MWh
- Payback
- 13 months
- Annual Fuel Savings
- 266.1 metric tons
- Annual CO₂ Emissions Avoided
- 838.4 metric tons
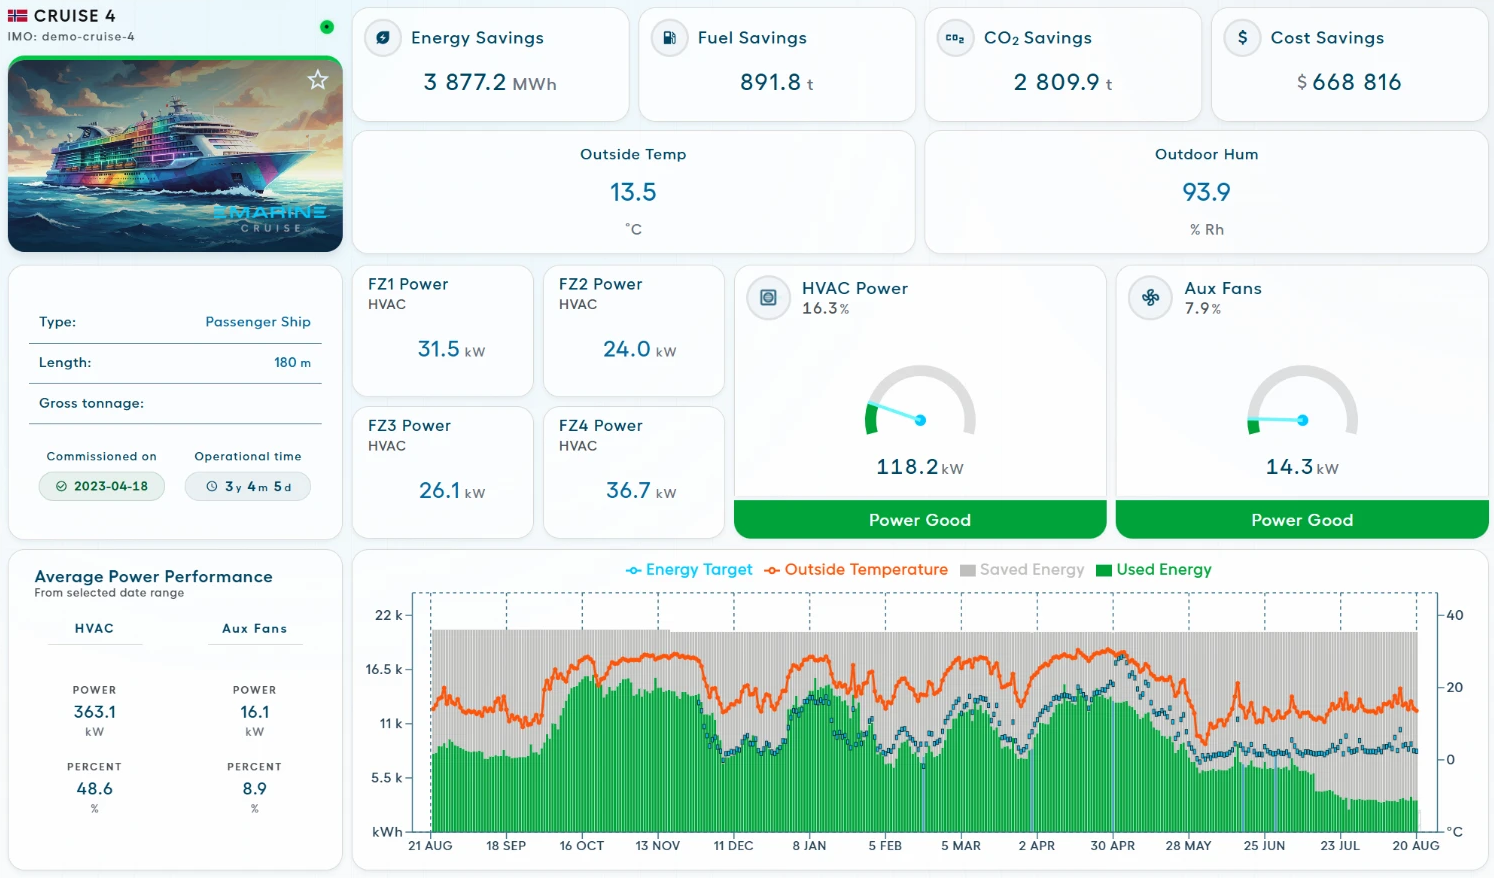
Cruise Vessel
Passenger ship · 180 m · eMarine system commissioned: 18 April 2023
- Annual Cost Savings
- USD 668,816
- Annual Energy Savings
- 3,877.2 MWh
- Payback
- 11 months
- Annual Fuel Savings
- 891.8 metric tons
- Annual CO₂ Emissions Avoided
- 2,809.9 metric tons
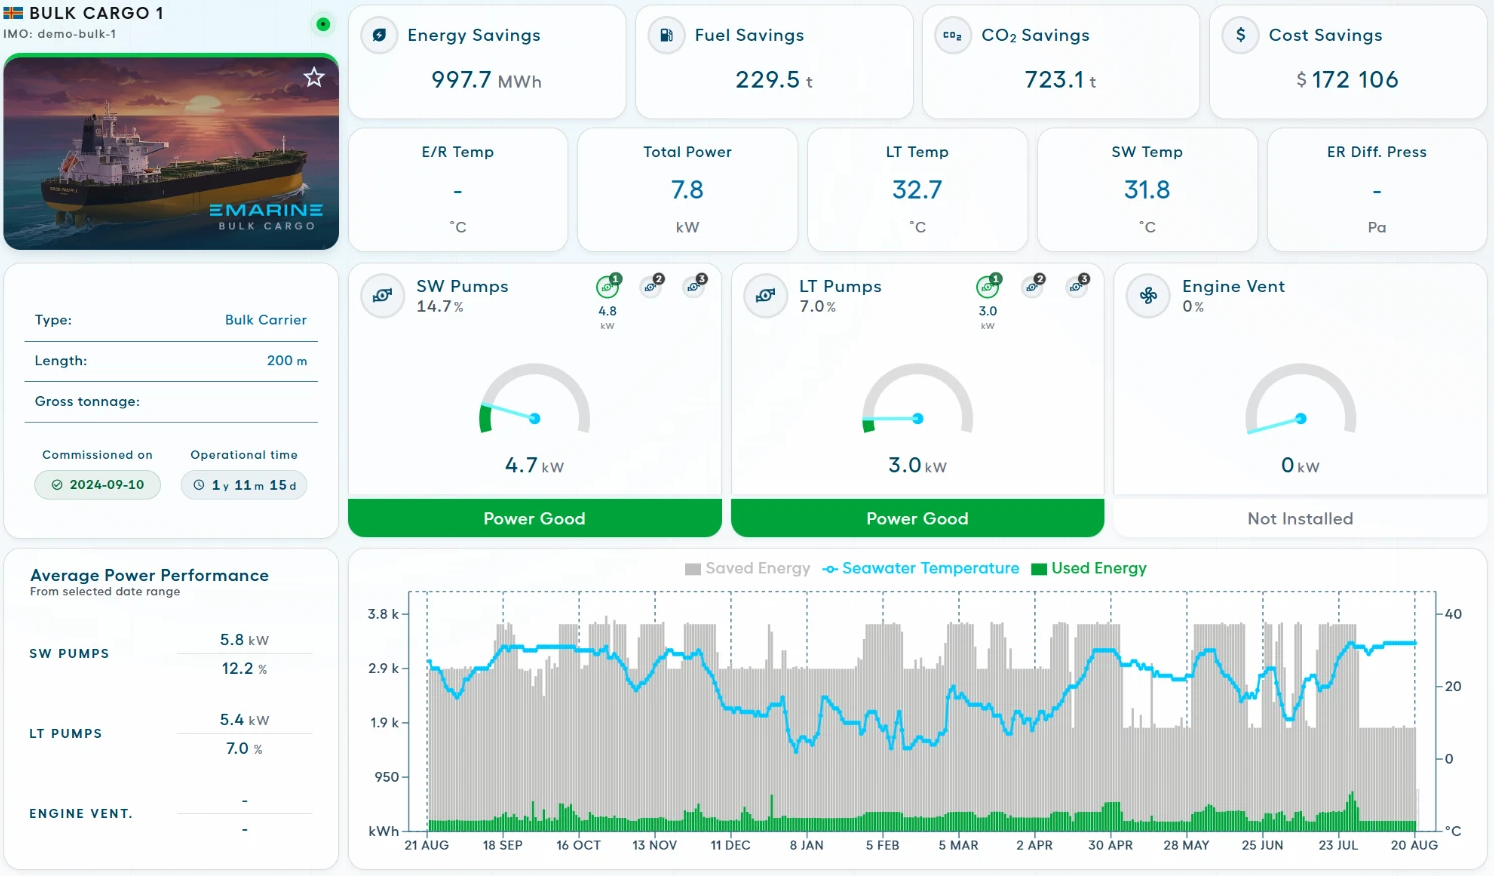
Bulk Carrier
200 m · eMarine system commissioned: 10 September 2024
- Annual Cost Savings
- USD 172,106
- Annual Energy Savings
- 997.7 MWh
- Payback
- 11 months
- Annual Fuel Savings
- 229.5 metric tons
- Annual CO₂ Emissions Avoided
- 723.1 metric tons
Methodology: Energy savings are verified against an agreed baseline using the latest 365 days of operating data. Fuel, cost and CO₂ equivalents are calculated using defined conversion factors and fuel-price assumptions. Cost savings use an assumed fuel price of USD 750 per metric ton. CO₂ avoided is calculated using 3.15 metric tons of CO₂ per metric ton of fuel.
What Could Your Vessel Save?
Provide your vessel data and technical documentation and let our engineers calculate the energy-saving potential, investment and payback.